There was a time HR ran on gut feel and annual surveys. That time’s over. 81% of HR leaders now consider analytics essential for strategic planning, and honestly, if you’re still making hiring or retention decisions off instinct alone, you’re already behind; most of your competitors aren’t.
What is HR analytics?
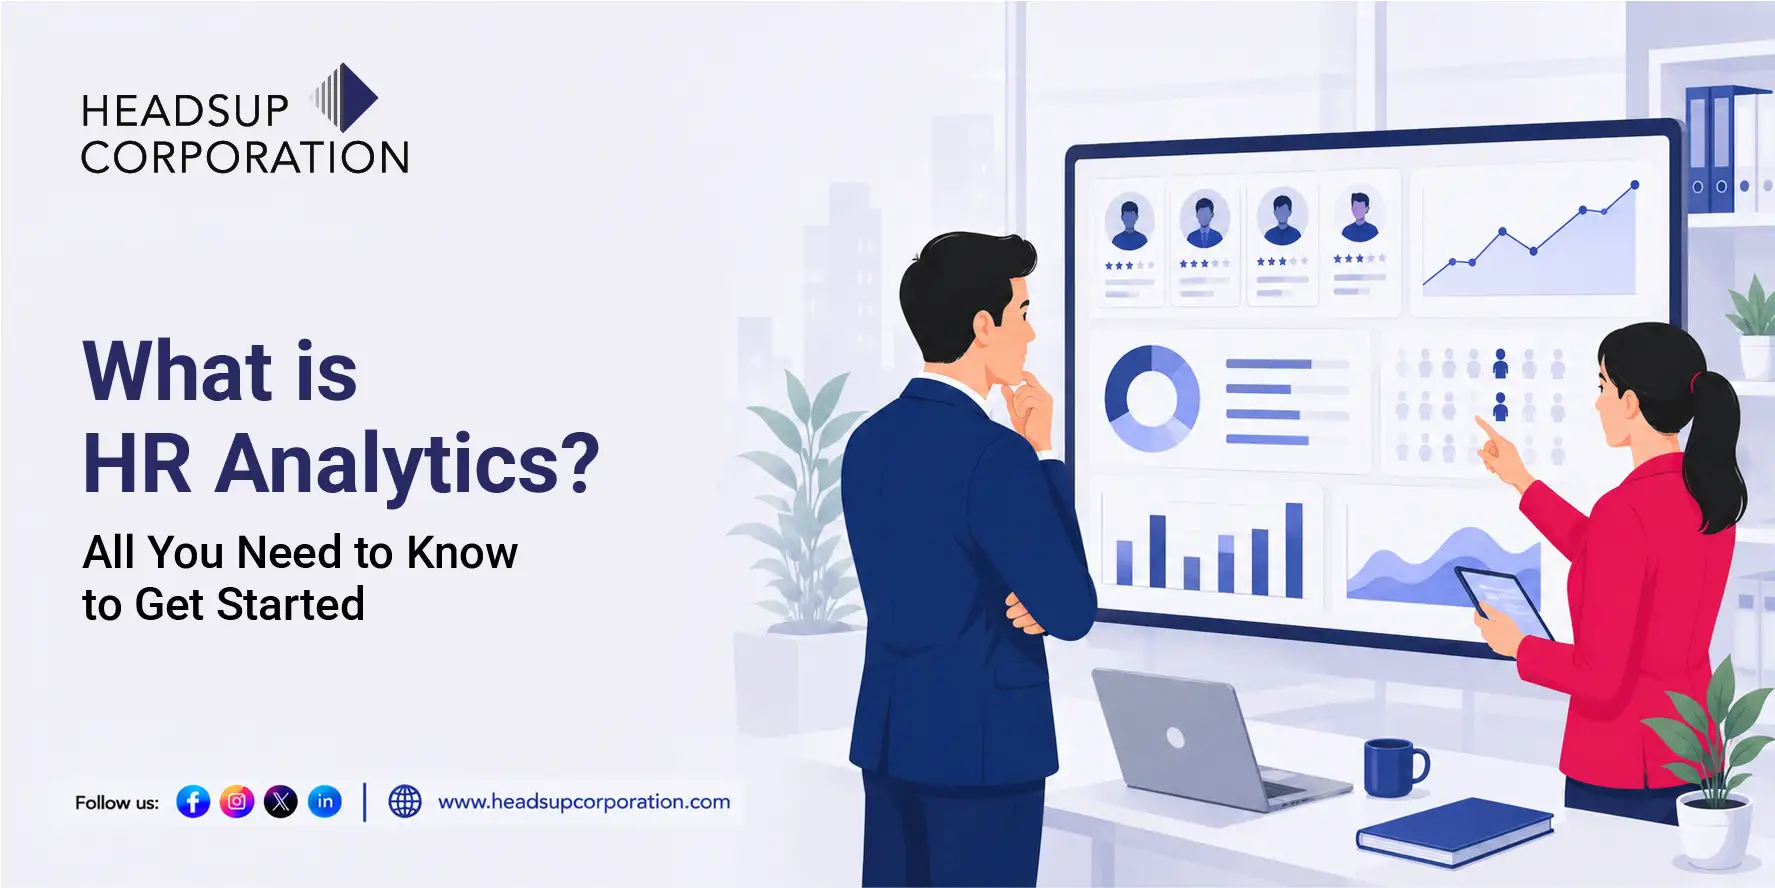
HR analytics is the practice of collecting and analysing workforce data- attrition, performance, engagement, hiring, compensation- to make better people decisions. It ranges from basic reporting (how many people left last quarter) to predictive modelling (who’s likely to leave next quarter, and why).
What is HR analytics used for?
In practice, it’s used to spot attrition risk before someone resigns, identify which hiring channels actually produce good performers, figure out which teams are burning out, forecast future headcount needs, and justify budget decisions with numbers instead of anecdotes.
Importance of HR analytics
The gap between companies doing this well and companies still guessing is widening fast. Organisations with mature HR analytics practices are 5x more likely to act constructively on data insights than those without, and 3.2x more likely to outperform competitors. Predictive attrition models specifically can identify over 70% of leavers three to six months ahead; that’s a window most companies currently waste because they’re not looking.
HR analytics examples
- Turnover prediction, flight-risk scoring based on tenure, engagement scores, manager ratings, and compensation position relative to market.
- Recruitment analytics, tracking which sourcing channels and interview stages actually predict on-the-job performance, not just faster time-to-fill.
- Engagement analytics, connecting pulse survey data to specific team or manager patterns rather than treating engagement as one company-wide number.
- Compensation modelling, forecasting the cost impact of raises, promotions, or restructuring scenarios before committing to them.
Key HR metrics
The ones worth tracking consistently: attrition rate (overall and by high-performer segment), time-to-fill, cost-per-hire, engagement score trend, internal mobility rate, manager effectiveness score, and absenteeism rate. Fewer, well-tracked metrics beat a dashboard with forty numbers nobody checks.
Data analytics in HR: How to get started
Don’t start by buying a platform. Start by picking one problem worth solving; attrition among your best performers is usually the highest-value place to begin, and work backwards to what data you’d need to see it coming. Most Indian mid-market companies already have this data sitting in their HRMS; it’s rarely collected properly and almost never connected across systems.
How to build an HR analytics workflow: 8 steps
- Pick one high-value problem (attrition, hiring quality, engagement).
- Audit what data you already have and where the gaps are.
- Clean and centralise it; 74% of organisations cite data quality as their biggest implementation barrier, so don’t skip this.
- Choose the simplest tool that answers your question: a dashboard before a machine learning model.
- Build a baseline (what’s normal for your company).
- Add predictive scoring only once the baseline is solid.
- Connect every insight to a specific action someone owns.
- Review and recalibrate quarterly; models decay as your workforce and market shift.
How to transition from descriptive to predictive and prescriptive analytics in HR
Descriptive analytics tells you what happened (attrition was 18% last year). Predictive analytics tells you what’s likely to happen next (these 12 employees show flight-risk signals). Prescriptive analytics recommends what to do about it (schedule a stay conversation, adjust their comp band, or flag for a role change). Most companies should move through these in order; jumping straight to predictive modelling without solid descriptive data underneath it just produces confident-sounding wrong answers.
How Headsup Corporation builds HR analytics capability for Indian companies
We help growth-stage Indian companies get from scattered spreadsheets to a working analytics foundation, starting with the one metric that actually matters to their board (usually attrition or hiring quality), not a generic dashboard rollout. Given 74% of implementations stumble on data quality, our audits start there before recommending any tool or platform.
Sitting on HR data you’ve never actually analysed? Headsup Corporation can help you find the one metric worth starting with; reach out for an analytics readiness audit.